A set of functions to pre-process geolocation tracking data. This includes both light loggers, GPS loggers of all kinds, and tries to ensure interchangeability between various devices and formats for synthesis and analysis. Currently the set of functions is limited but we are sure this set will grow over time, due to personal use or user contributions.
Due to the inclusion of a high resolution geoid map the package is fairly large (97 MB). This is less than ideal, yet functional. A solution will be sought for this situation to be more CRAN compliant.
Warning: this package is made on personal request and therefore is a temporary convenience tool. Although the intention is to solidify some of this more permanently, when and how is to be seen. The package might therefore change name and function at any time. Do not rely on this code operationally in an online workflow.
Installation
development release
To install the development releases of the package run the following commands:
if(!require(devtools)){install.packages("devtools")}
devtools::install_github("bluegreen-labs/geoloctools")
library("geoloctools")
Use
Reading PathTrack position (.pos) files
The glt_read_pos() function reads in PathTrack position files into a data frame. By default the altitudes are reported as values above mean sea level (corrected from ellipsoide heights to topographic heights by compensating for egm2008 one degree geoid model). We do note that due to the bilinear interpolation instead of cubic interpolation a slight loss in accuracy is noted. However, with an error of 0.025m this value is well below the error on commercial animal loggers.
library(geoloctools)
df <- glt_read_pos("your_position_file.pos")
Converting Migrate Technology data to PAMLr formatting
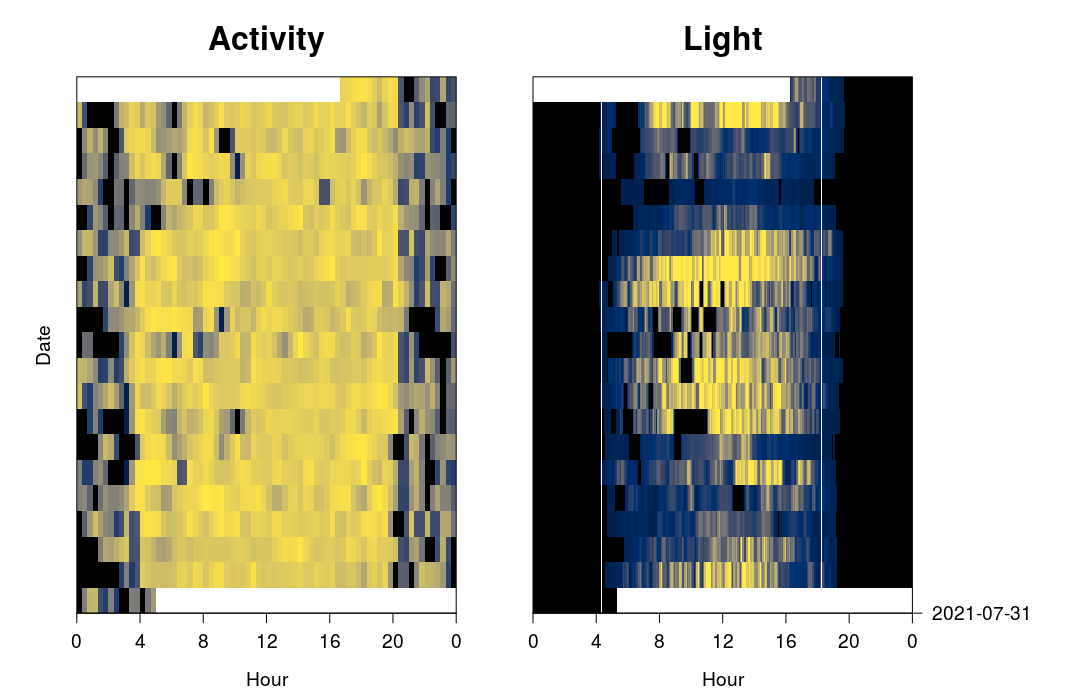
If you’ve installed the package you can also generate activity and light logging plot (based upon the code in the PAMLr documentation) by converting Migrate Technology light logger files to the PAMLr R package format for further processing.
library(geoloctools)
library(pamlr)
library(tidyverse)

# load demo data from Migrate Technologies files
PAM_data <- glt_migtech_pamlr(
  system.file(
        "extdata",
        package = "geoloctools",
        mustWork = TRUE)
  )

# grab one particular logger (subset main list)
PAM_data <- PAM_data$CC893

# plot activity and light levels as shown in the
# PAMLr documentation
par( mfrow= c(1,2), oma=c(0,2,0,6))
par(mar =  c(4,2,4,2))

plot_sensorimage(PAM_data$acceleration$date, ploty=FALSE,
                 log(PAM_data$acceleration$act+0.001), main = "Activity",
                 col=c("black",viridis::cividis(90)), cex=1.2, cex.main = 2)

plot_sensorimage(PAM_data$light$date, labely=FALSE,
                 PAM_data$light$obs,  main="Light",
                 col=c("black",viridis::cividis(90)), cex=1.2, cex.main = 2)