gee_subset
Google Earth Engine subset script & library
![]()
Google Earth Engine subset script & library
This is a small python script to subset GEE gridded data products into time series for a given location or list of locations. This script should make it easier to subset remote sensing time series for processing external to GEE. If this code made your life easier please refer to it using the Zenodo citation as:
Hufkens K. (2017) A Google Earth Engine time series subset script & library. DOI: 10.5281/zenodo.833789.
Installation
Make sure you have a working Google Earth Engine python API setup. The installation instructions can be found on the GEE developer site.
After this you can either install by cloning the repository:
git clone https://github.com/khufkens/google_earth_engine_subsets.git
or, when integrating the script in other python code by using pypi:
pip install gee-subset
Use
command line
Below you find an example call to the scrip which downloads MODIS MYD09Q1 (-p, –product) reflectance data for bands 1 and 2 (-b, –band) for a number of sites as listed in selected_sites.csv and saves the results on the users desktop (-d, –directory).
./gee_subset.py -p "MODIS/MYD09Q1" \
                -b "sur_refl_b01" "sur_refl_b02" \
                -f "~/Desktop/selected_sites.csv" \
                -d "/Users/foo/Desktop/"
# prints output to console
./gee_subset.py -p "LANDSAT/LC08/C01/T1" \
                -b "B1" "B2" \
                -s "2015-01-01" \
                -e "2015-12-31" \
                -l 44.064665 -71.287575
Sites can be listed as a latitude longitude tuple using the -loc parameter, or by providing the before mentioned csv file (-f, –file parameter). Either one should be provided.
The csv file is a comma delimited file of the format:
site, latitude, longitude.
A padding value can be provided (-pd, –pad) so one can download a rectangular window of data padded x km in either direction around a particular location. This option is limited by the maximum pixels which GEE can export. For normal use (i.e. 1 to 2 km padding) this should not present a problem for most products.
General help can be queried by calling:
./gee_subset.py -h
python module
In addition the script can be loaded as a library in a python script module by calling:
import gee_subset

# or for the module itself
from gee_subset import gee_subset
The function is called gee_subset(). Consult the script for correct parameter naming conventions. Currently minimum error trapping is provided.
When using the python module remember that the module does not support lazy loading of dependencies. You will need the start your code with:
# load required modules
# these are required and the module
# will fail without them!
import os, re
import pandas as pd
from datetime import datetime
import ee
from gee_subset import gee_subset

# Initialize earth engine
ee.Initialize()

# your call (below a MODIS example)
df = gee_subset(product = "MODIS/MYD09Q1", bands = ["sur_refl_b01", "sur_refl_b02"], start_date = "2015-01-01", end_date = "2015-12-31", latitude = 44, longitude = -72, scale = 30)

print(df)
Data format
The output of the script is tidy data in which each row is an observation. Multiple observations can be returned in case a padding value is specified. Multiple bands can be called at once by providing multiple valid bands as an argument. Multiple bands will be returned as columns in the tidy data format. When datasets overlap, such as is the case of sidelapped tiles in Landsat 8 data multiple values are returned for a given location or date. In this case the id column will inform you on the source of the data.
Demo code
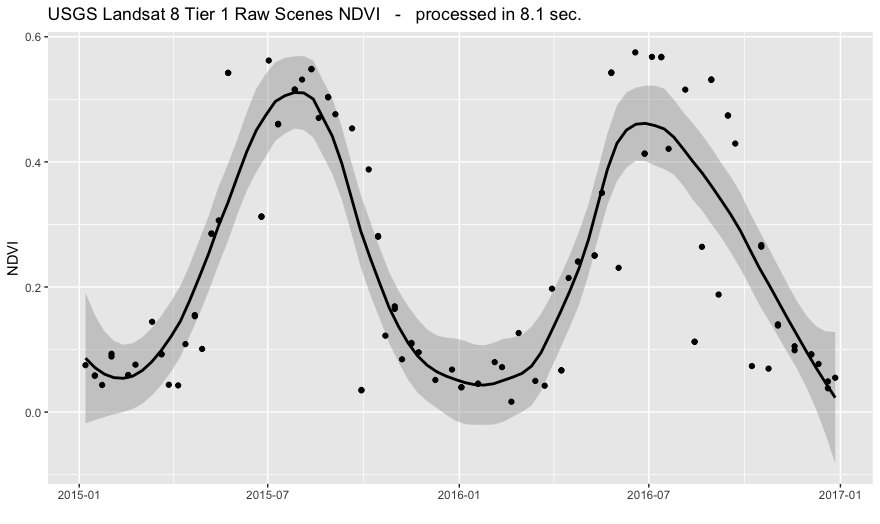
An example query, calling the python script from R, downloads two years (~100 data points) of Landsat 8 Tier 1 data for two bands (red, NIR) in ~8 seconds flat. Querying for a larger footprint (1x1 km footprint) only creates a small overhead (13 sec. query). The resulting figure for the point location with the derived NDVI values is shown below. The demo script to recreate this figure is included in the examples folder of the github repository.
References
Hufkens K. (2017) A Google Earth Engine time series subset script & library. DOI: 10.5281/zenodo.833789.