3 ggplot demo
Warning
Installing and loading ggplot2 on webR takes a little while.
3.0.1 Basic plotting
- Load the package and some data
- create a plot
Exercise
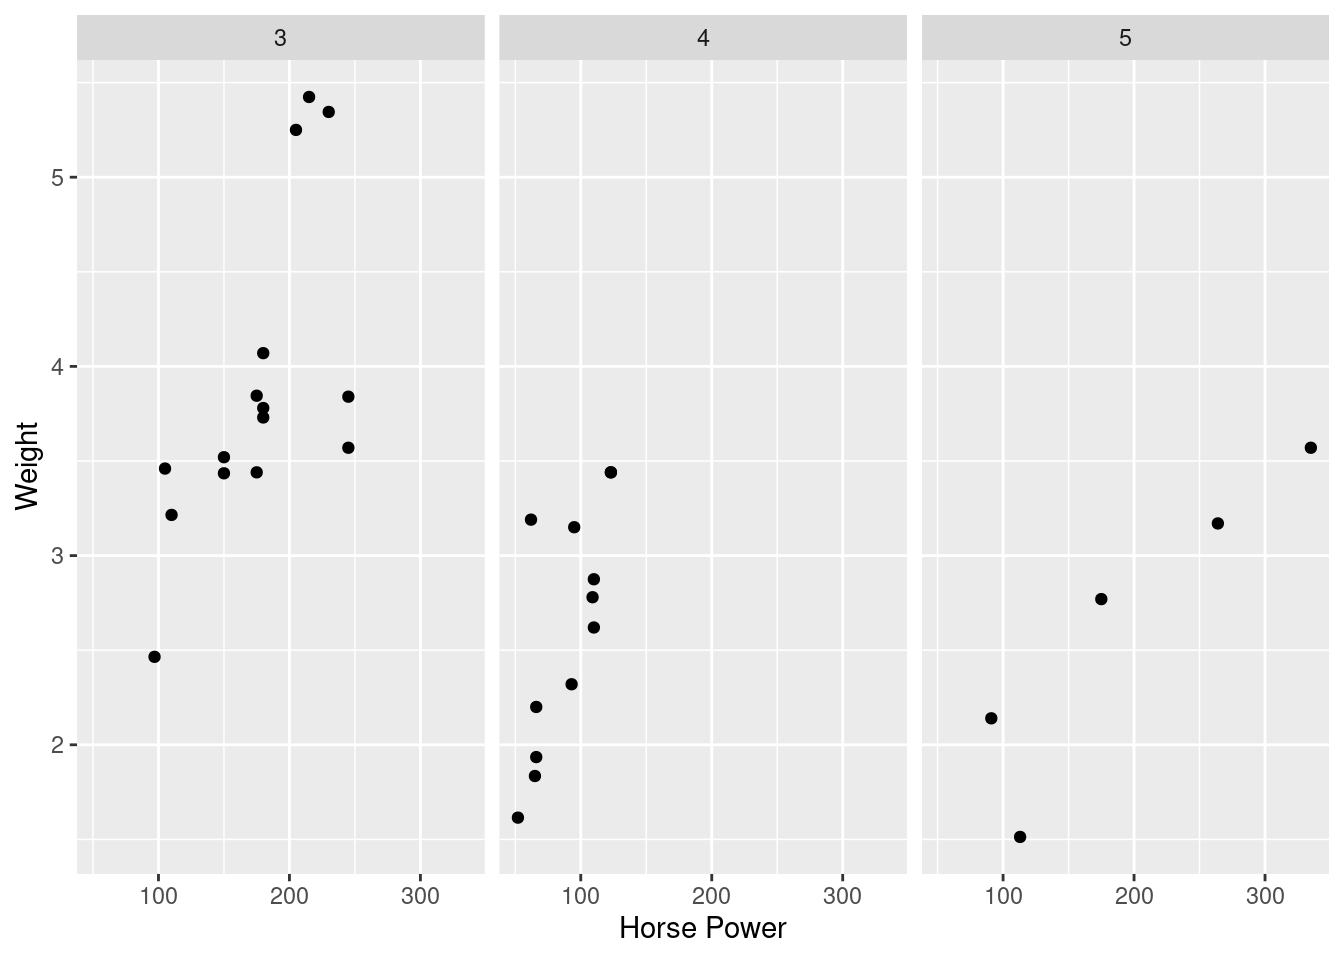
Make a scatter plot with hp on the x axis and wt on the y axis. Label the x axis “Horse Power” and the y axis “Weight”. Make one subplot for each value in gear.
Your result should look like the plot below
Expected Result